FUNDCLASS propose une analyse objective du risque et de la performance des fonds, qui conduit à un classement clair de l'ensemble des fonds disponibles sur le marché.
- La performance réalisée par un fonds dépend de la stratégie sous-jacente et, par conséquent, des risques inhérents
- Le profil de risque de chaque fonds est calculé à l'aide des outils APT et des données du groupe FIS. Environ 200 catégories homogènes sont nécessaires pour couvrir tous les types de profil de risque
- Le classement prend en compte le niveau de risque supporté par l'investisseur
- Le classement est établi en fonction du RAP du fonds dans sa catégorie
- Dans chaque catégorie, le rendement ajusté du risque (RAP) de chaque fonds est:
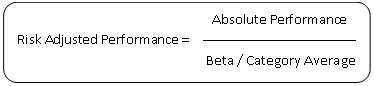
Performance et RAP sont évalués sur une période d'un an.
- La performance est comparée à celle des fonds concurrents plutôt qu'aux indices de référence
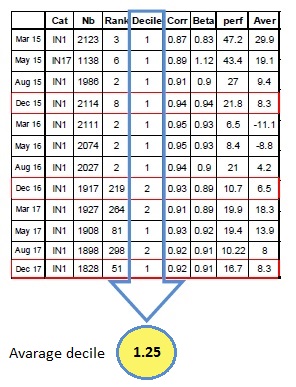
- Le processus est effectué tous les trimestres et stocké pour chaque fonds
Avant de comparer les fonds, il est essentiel d'établir des sous-groupes cohérents au sein de la population de fonds.
FUNDCLASS a adopté une approche "buy side", ce qui signifie que nous considérons qu'un fonds ne peut être comparé qu’à un fonds ayant un profil de risque similaire.
- La catégorisation détermine l'univers de référence des fonds concurrents
- La notation doit être basée sur la performance des fonds concurrents au sein de la même catégorie
- La note doit refléter la performance dans le moyen terme
- Un fonds qui figure dans les 12 derniers classements trimestriels basée sur des performances annuelles obtient une note égale à son décile moyen
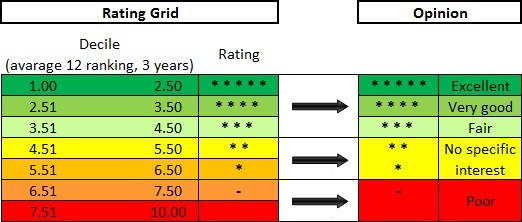
- FUNDCLASS a défini une échelle de notation basé sur le décile moyen
Notation des sociétés de gestion d'actifs
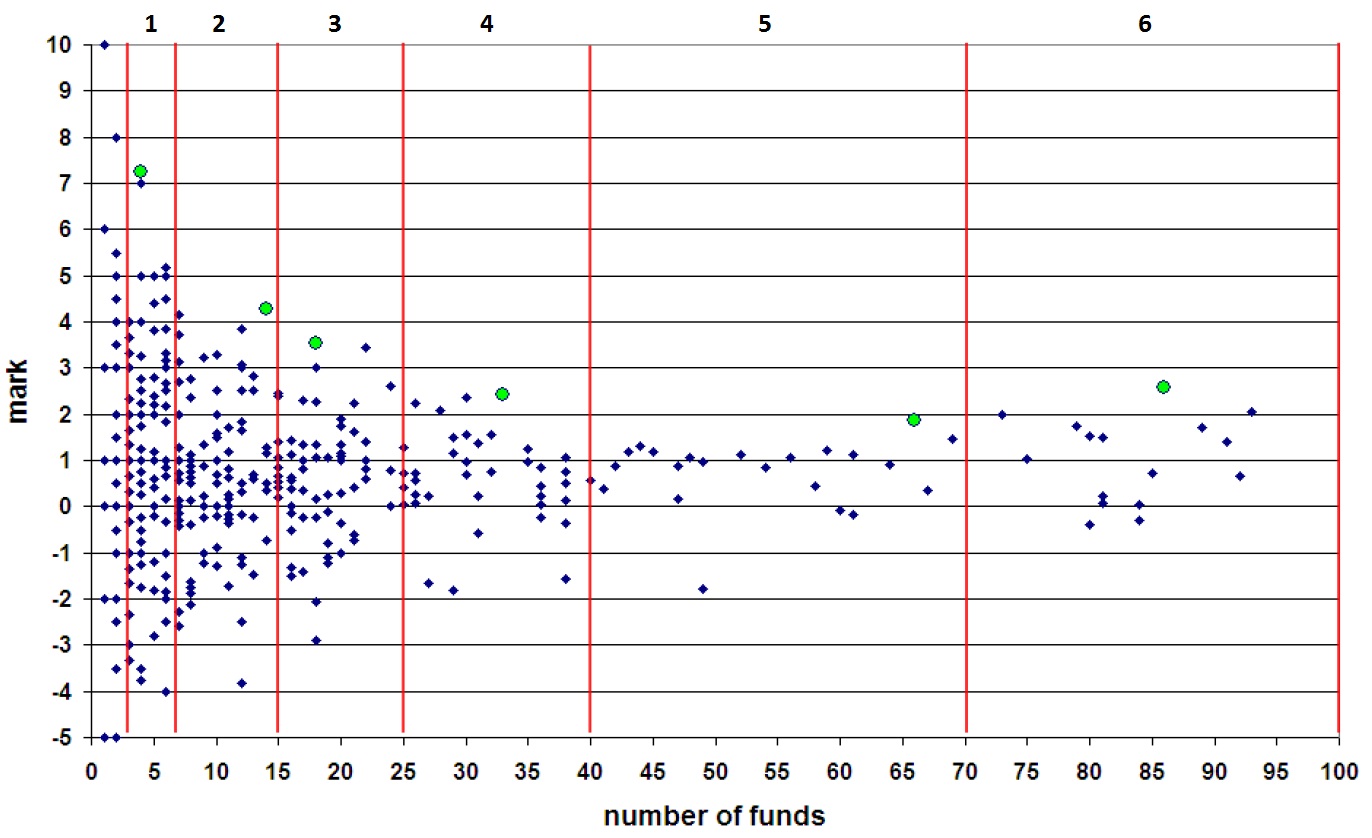
Chaque société européenne de gestion d'actifs disposant d'un fonds est notée. Afin de créer des groupes cohérents, les catégories sont définies par le nombre de fonds notés.
·
- Échelle d'évaluation pour la notation des fonds:
![]()
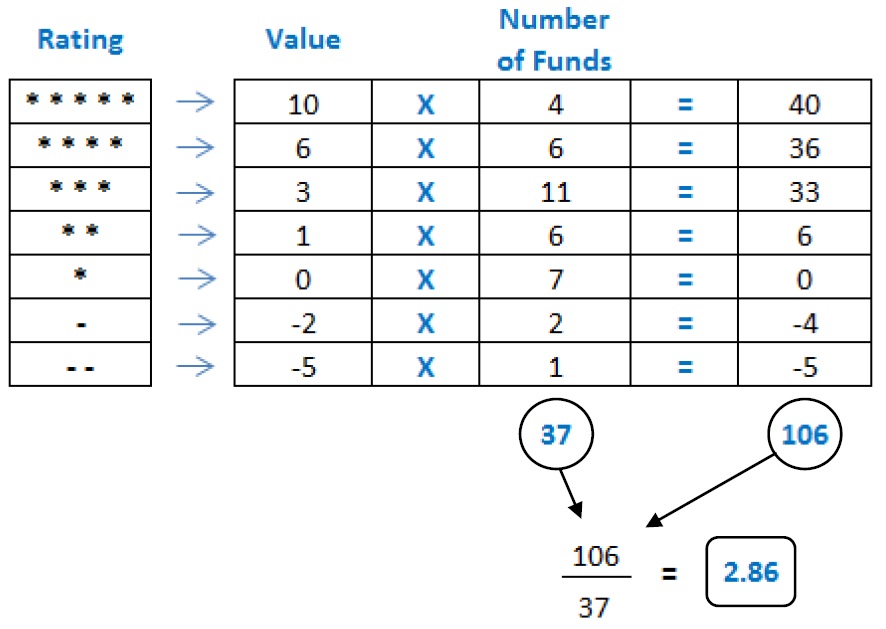
- Nous considérons l’ensemble des fonds notés d’une société de gestion pour calculer la note moyenne pondérée:
- Nous calculons la note moyenne de toutes les sociétés de gestion.
- Nous définissons 8 catégories selon le nombre de fonds notés:

Les petites sociétés de gestion d'actifs, avec moins de 4 fonds détenus, ne concourent pas.
- Dans chaque catégorie, le gagnant européen est la société de gestion d'actifs avec la note moyenne la plus élevée.